A health header that names what is wrong, a row of the five numbers you check most, and a grid of cards you can reorder, collapse or switch off. It opens the way you left it.
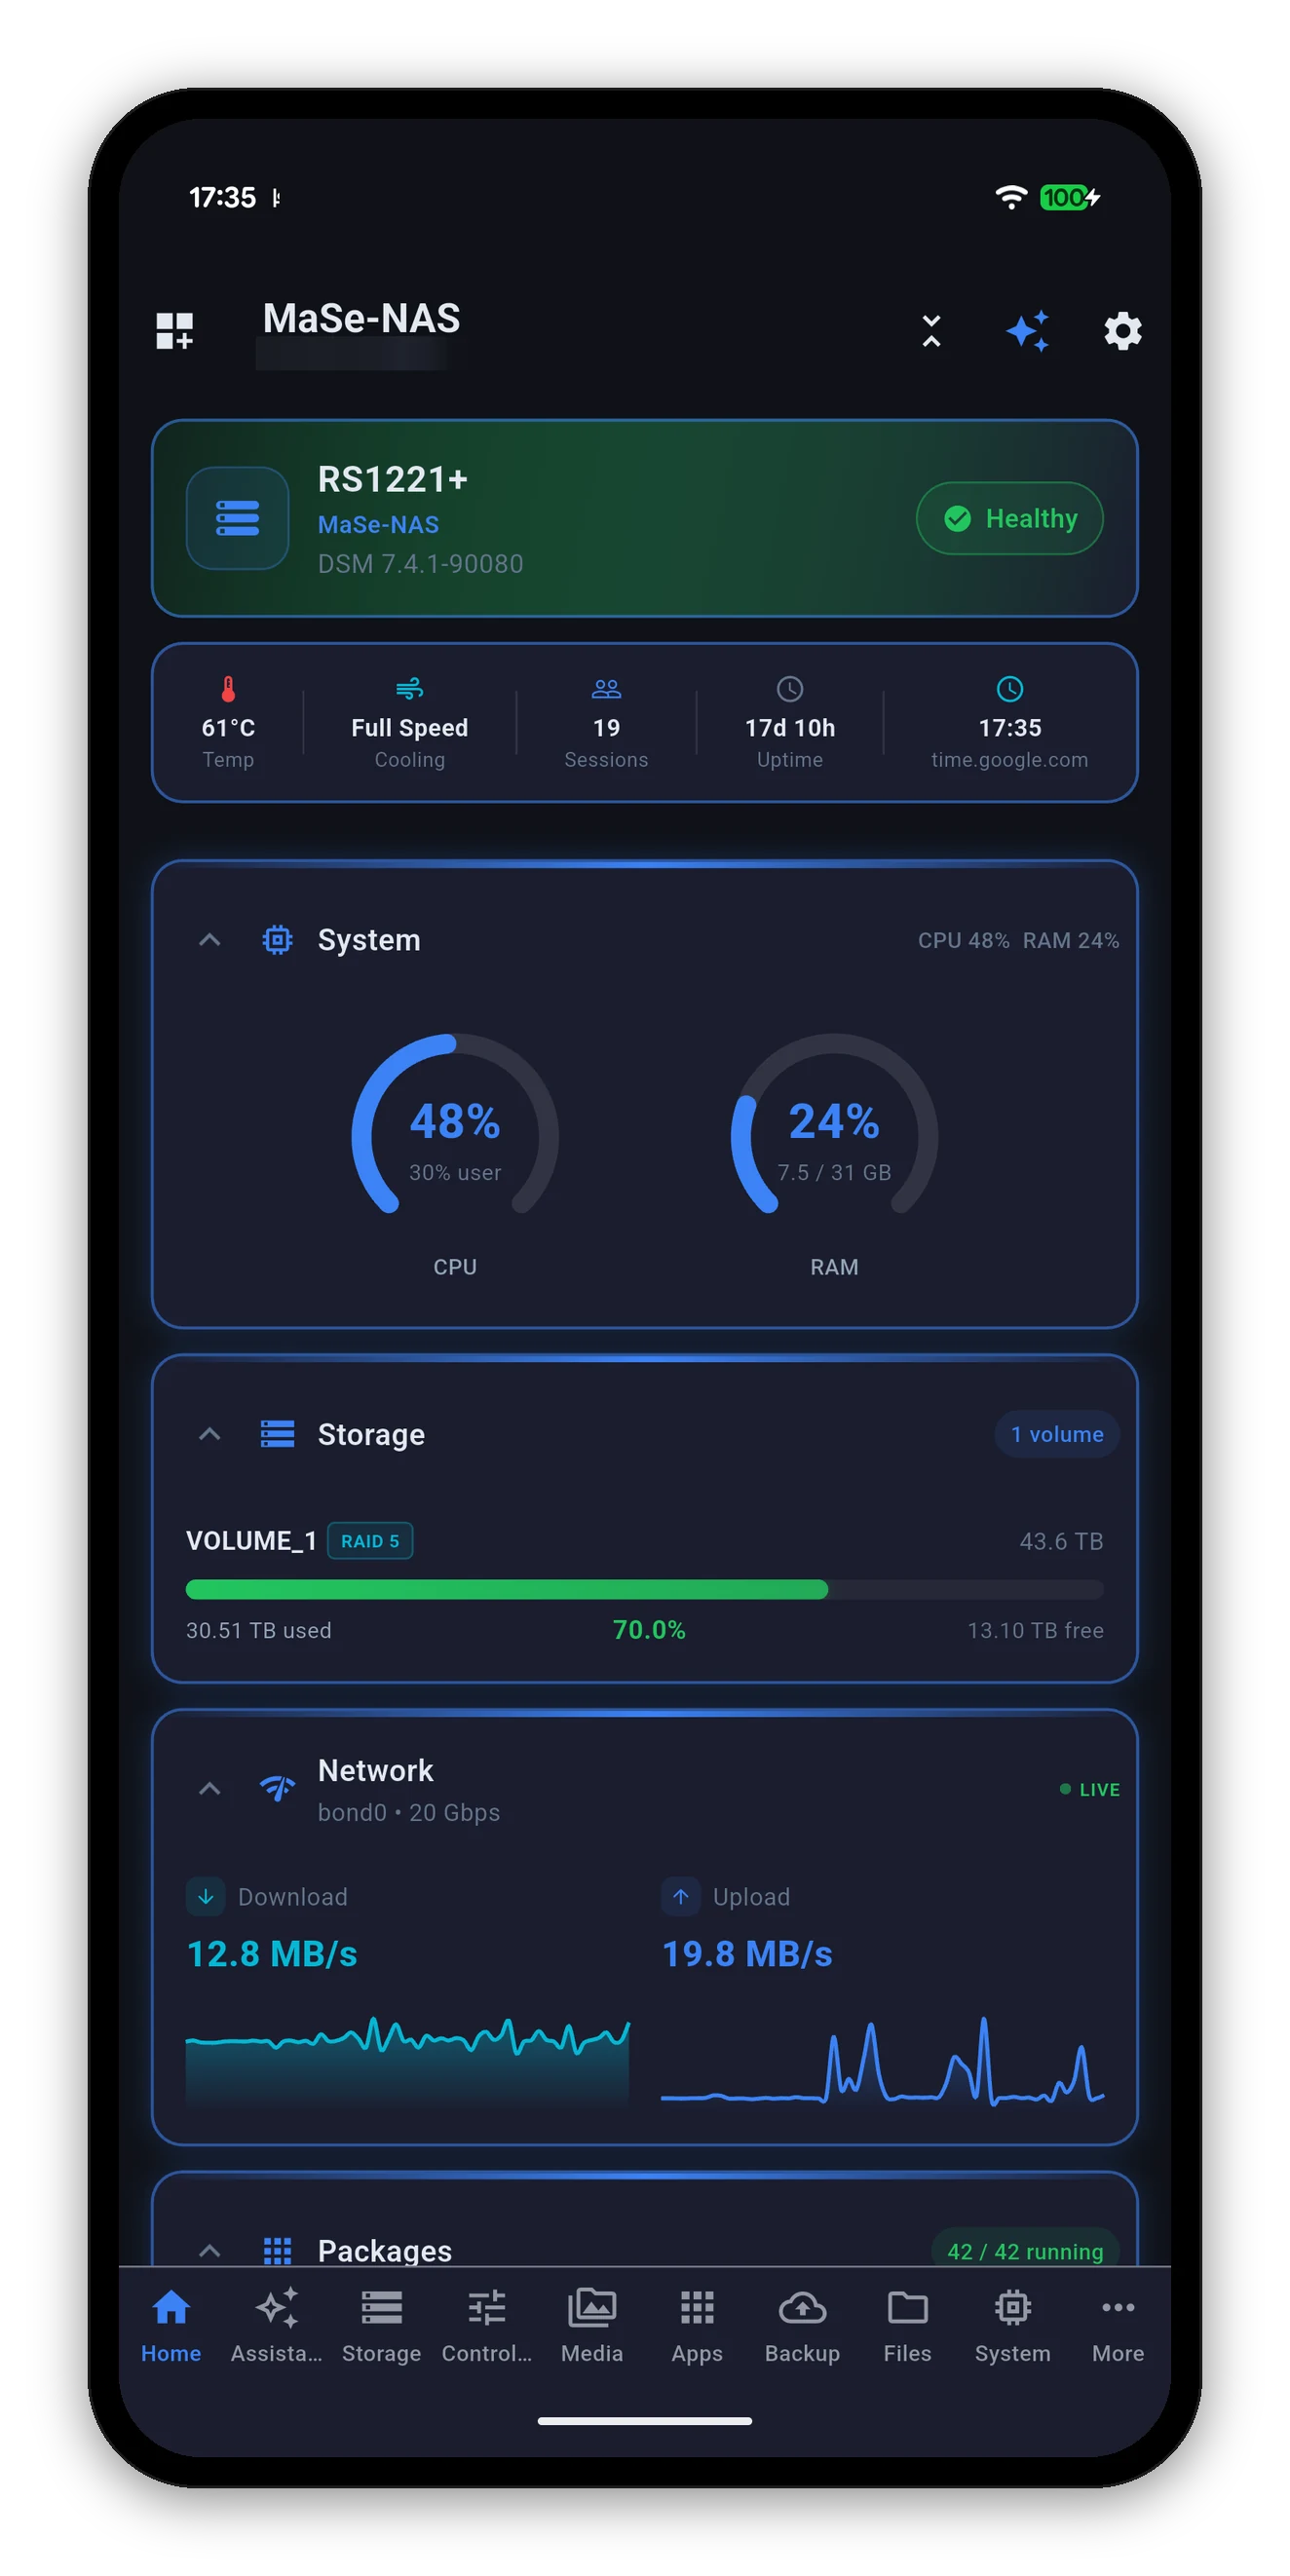
The top card names your model, your nickname for it and its DSM version, with a health badge on the right. The badge is not decorative - tap it and it lists what fed the verdict.
It will not show a healthy tick over a reading it could not take. If the app cannot reach the NAS, or a value came back missing, the header says that - loading, or unreachable - rather than quietly treating an absent number as a good one.
Five readings that answer "is it fine?" without scrolling.
| Reading | What it tells you |
|---|---|
| Temp | System temperature, in °C or °F depending on your preference. Colours shift amber then red as it climbs. |
| Cooling | The fan speed mode the NAS is actually in - Full Speed, Cool or Quiet. Change it from System. |
| Sessions | How many connections DSM currently holds. Tap through to Active Connections to see who they are. |
| Uptime | How long since the NAS last booted. |
| Time | The NAS's own clock and the time source it syncs against. A NAS whose clock has drifted breaks two-factor codes and makes log timestamps lie. |
Each card is a summary with a way into the full screen. Only cards your NAS supports are offered - the app asks DSM what it can do and never shows a card for a package that is not installed. Tap a card's title to open the screen it summarises.
| Card | What it shows | Opens |
|---|---|---|
| System | CPU and RAM gauges with the user share broken out. | System Health |
| Storage | Each volume with RAID type, a usage bar, used and free. | Volumes & Pools |
| Network | Live download and upload on the primary interface, with a sparkline. | Network |
| Resource Monitor | Rolling CPU, memory and disk I/O charts. | Resources |
| Disk Health | SMART state and temperature per drive. | Disk Health |
| Firmware | DSM version and whether an update is waiting. | System Health |
| Packages | How many DSM packages are installed and running. | Package Center |
| Docker | Running versus total containers, and the first few by name with uptime. | Docker |
| Docker Projects | Compose stacks and how many are up. | Projects |
| Virtual Machines | Virtual machines and their power state. | Virtual Machines |
| Surveillance | How many cameras are online out of the total. | Cameras |
| Photos | Library size and album count. | Photos |
| Drive | Synology Drive and team folders. | Drive |
| Backup | Hyper Backup tasks with size and next run. | Backup |
| Active Backup | Devices and tasks under Active Backup for Business. | Active Backup |
| Download Station | Active downloads with speed and progress. | Download Station |
| Task Scheduler | Enabled versus disabled tasks and the next few to run. | Tasks |
| UPS Status | Model, charge, estimated runtime and whether it is online. | Power |
| DDNS & External IP | Your public address and the hostname the NAS publishes, with a refresh. | DDNS |
| Log Center | The most recent system log entries, read once with a refresh button. | Logs |
| Shared Folders | Share names, their volume and whether they carry ACLs. | Shared Folders |
| Active Connections | Who is signed in, from where, over which protocol. | Connections |
| Services | Running versus stopped DSM services. | Services |
| Users | DSM accounts and their state. | Users |
| File Browser | A way into File Station. | File Station |
| USB Devices / External Storage | Attached USB and eSATA devices, with safe eject. | External |
| VPN | VPN client profiles configured on the NAS. | VPN |
| Notifications | How DSM is set to notify you - push, email, SMS. | Notification settings |
| Note Station / Office / Contacts | Notebooks, documents and address books. | Files |
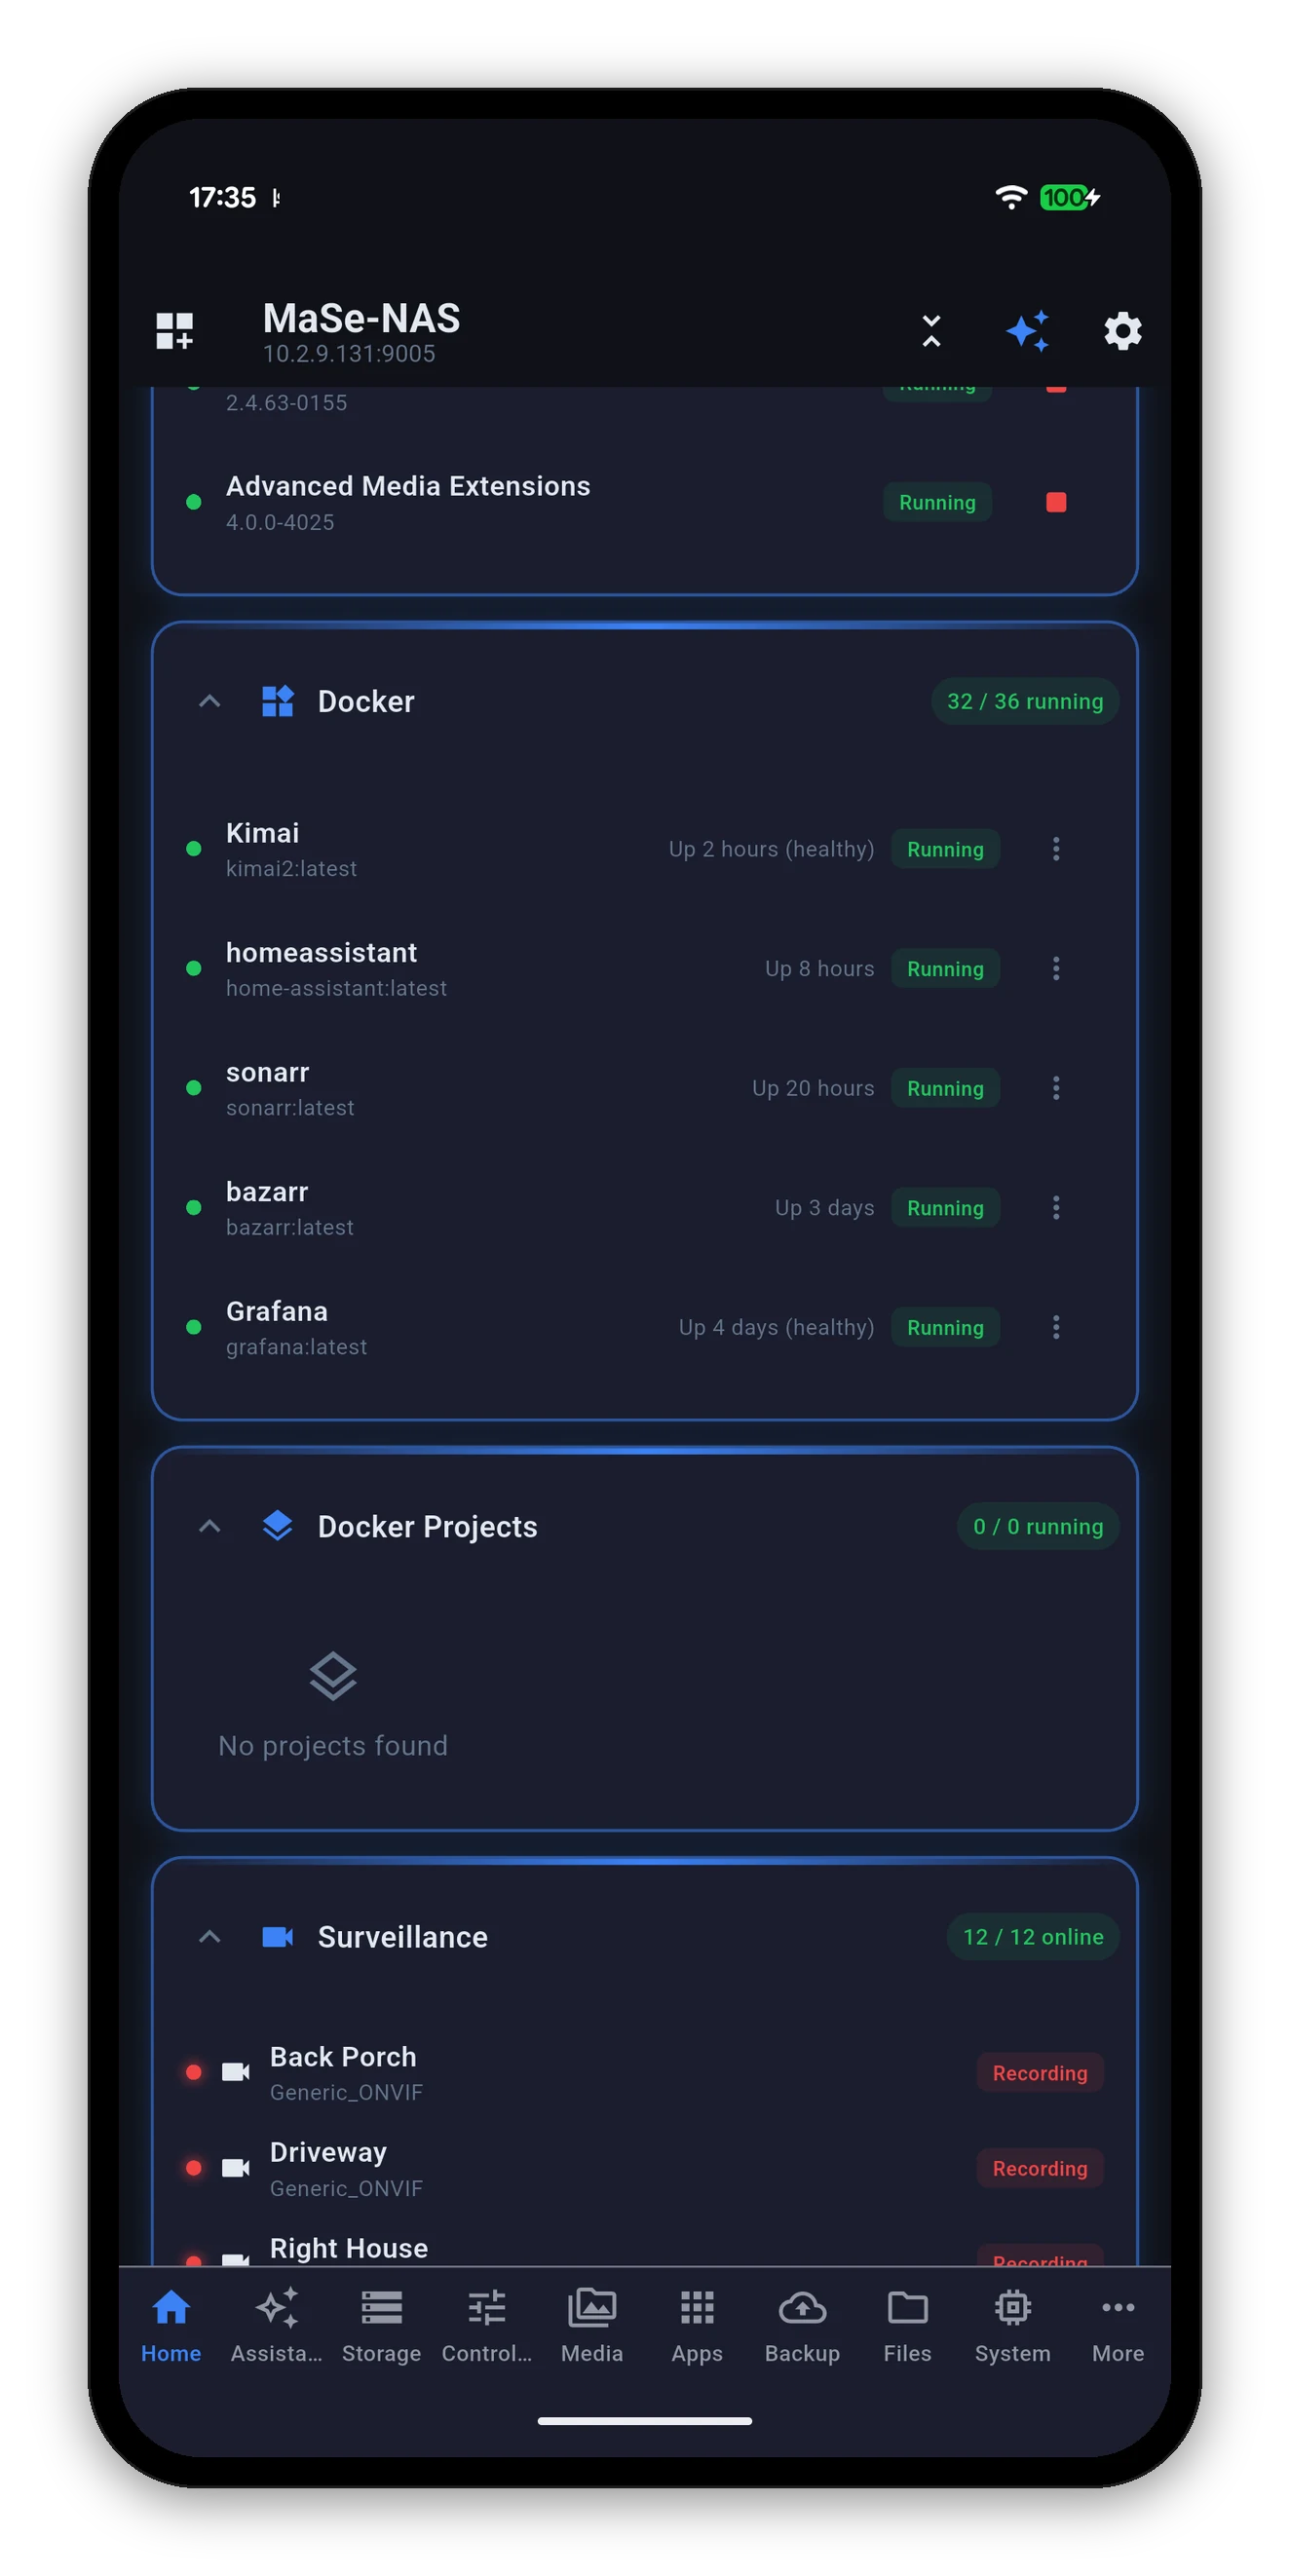
Two cards in the grid: each summarises, then opens the full screen.
Tap the chevron on any card to fold it. The choice is remembered per view and survives closing the app, so the dashboard opens the way you left it rather than resetting every launch.
Tap the pencil at the top left of the home screen. The toolbar appears and every card grows a drag handle and a red minus.
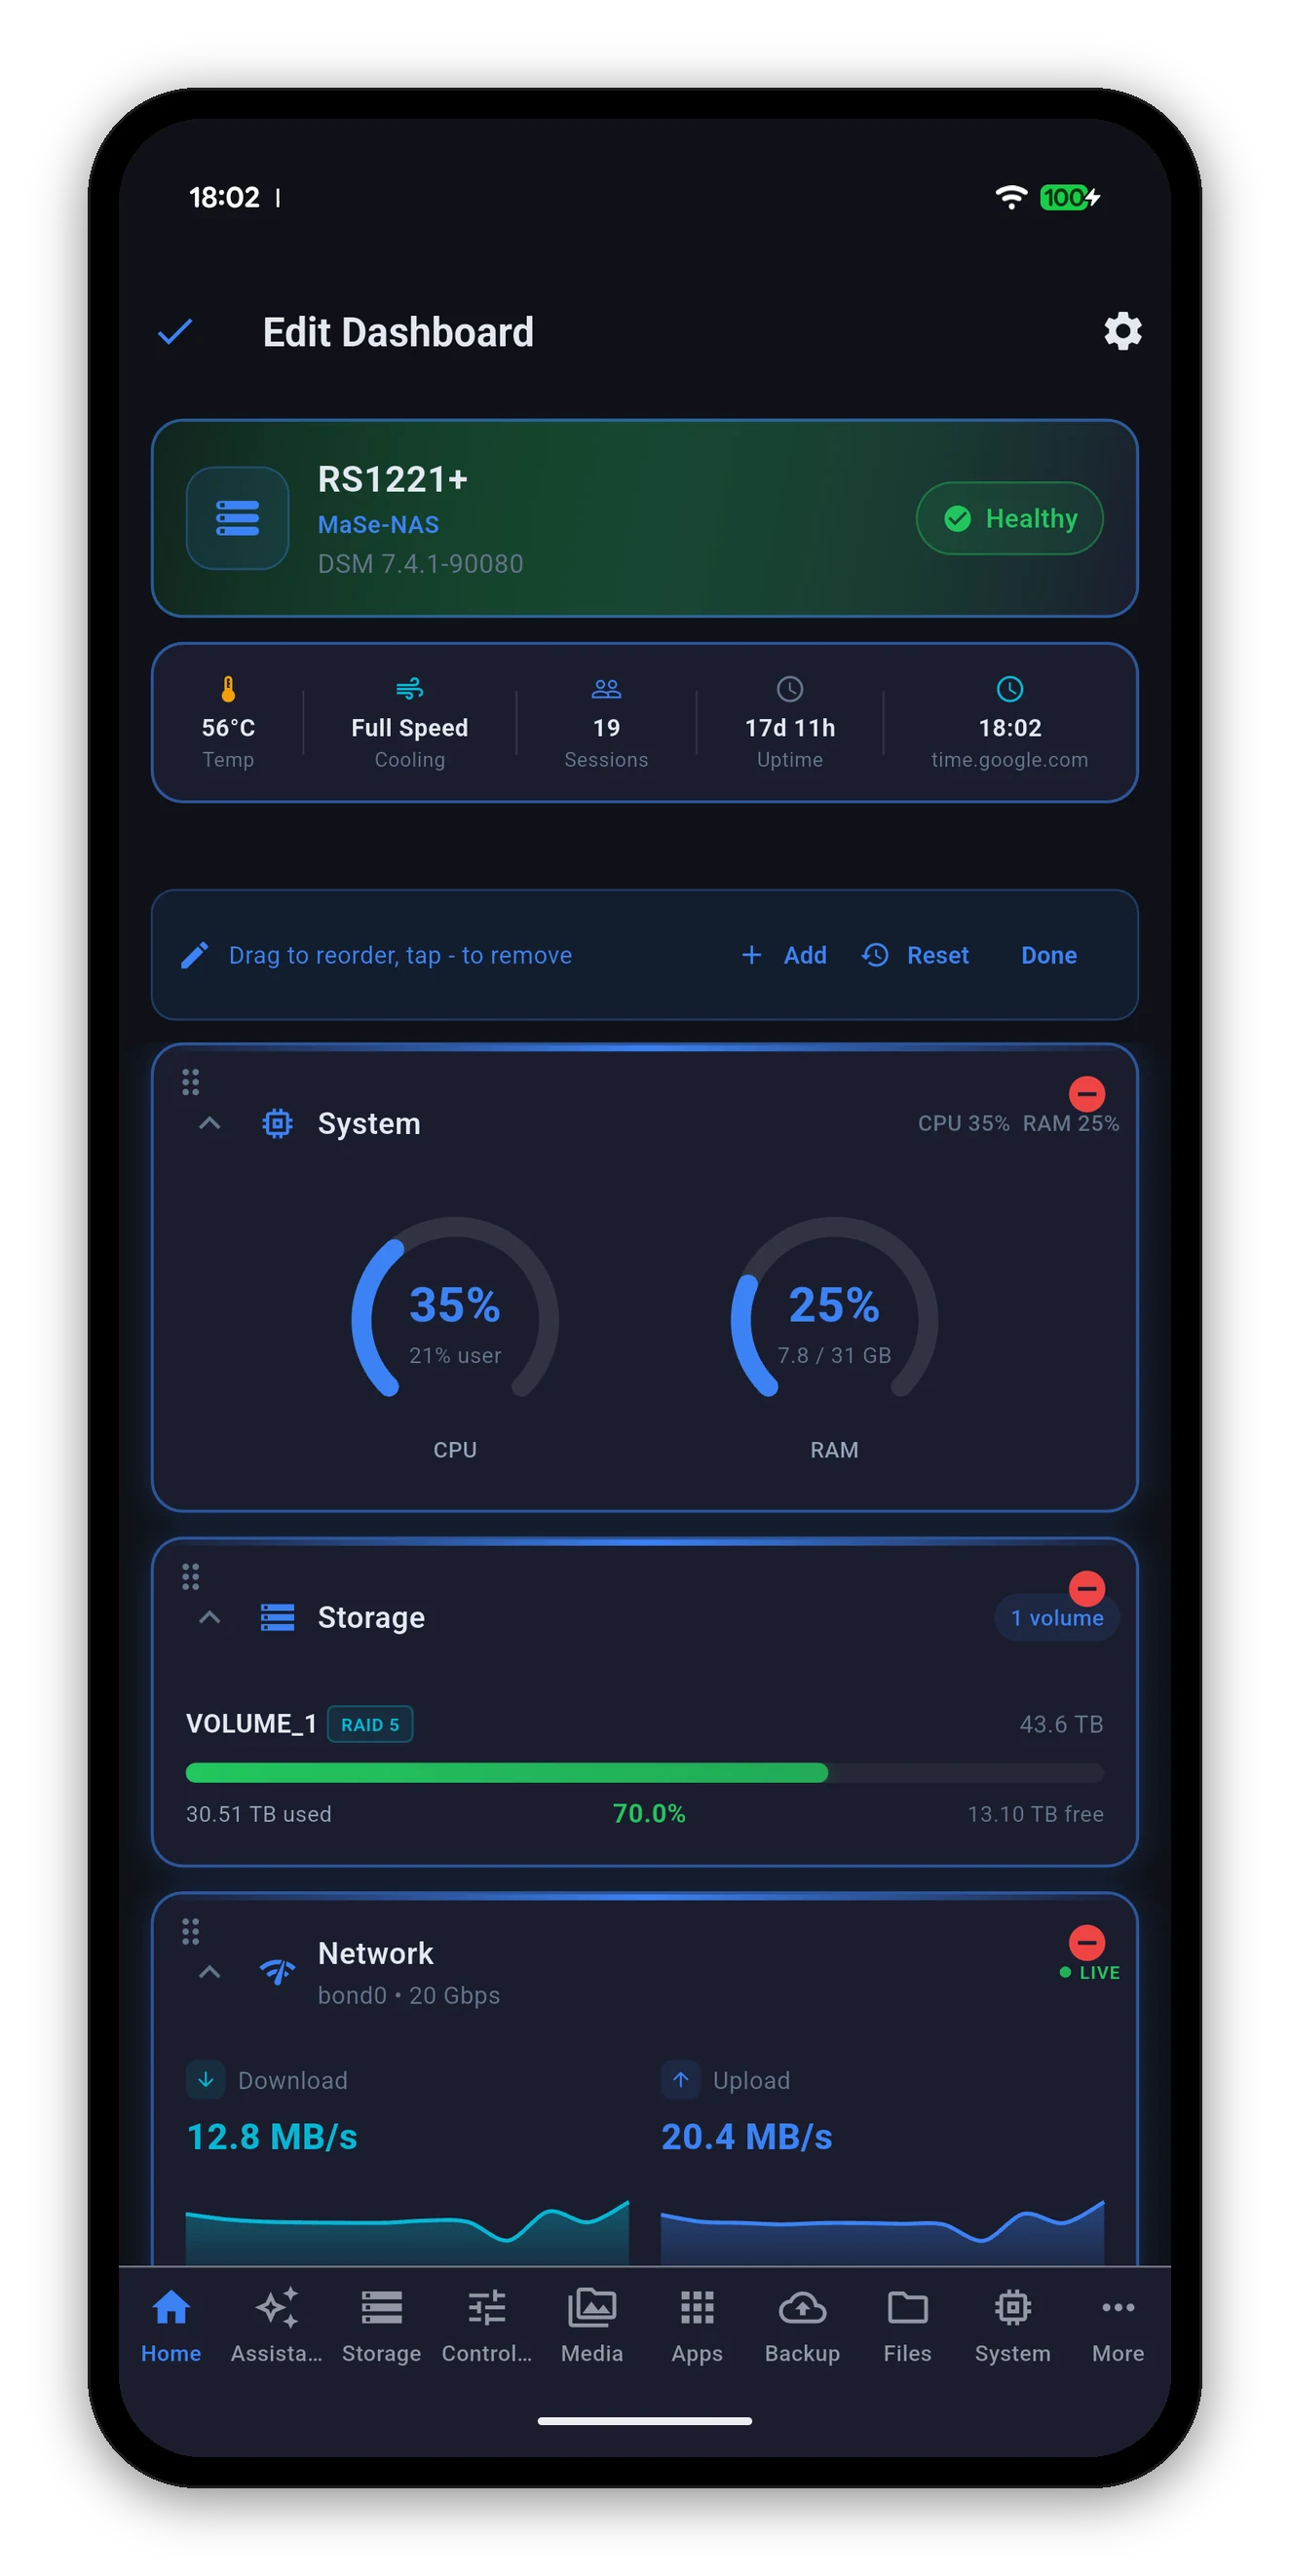
Live readings poll on a timer you set in Settings › Polling Interval: system values on the short interval, storage on a longer one, because volume usage does not change every five seconds and asking costs battery.
Gauges, load, temperature history, fan mode, DSM updates and power controls.
 Syno Manager